Creative
Consumer Insights: Leverage Surveys to Increase Product ROI

Hamayun Zafar
Senior Product DesignerIn this blog article, we share a strategic guide for product makers - whether they are starting to build a consumer base or already have one - focused on gathering and using surveys as a form of consumer insights.
We will share proven tactics for understanding customer behaviors and preferences while providing contextual methods for collecting and analyzing consumer data, and then synthesizing data into actionable recommendations.
What is the meaning and value of Consumer Insights?
Consumer insights are deep understandings of consumer behaviors, needs, and motivations derived from data analysis. They involve uncovering the ‘why’ behind consumer actions through surveys, interviews, and behavioral data.
Good UX is good for business
As plainly articulated by Forbes, Investing in good user experience (UX) is significantly beneficial for businesses.
Research by Forrester highlights that companies focusing on UX enjoy reduced customer acquisition costs, lower support expenses, higher customer retention, and increased market share.
The top 10 businesses excelling in customer experience have notably outperformed the S&P index, yielding almost triple the returns. Furthermore, Forrester Research indicates that, on average, each dollar spent on UX can yield a return of 100 dollars, amounting to an astounding ROI of 9,900 percent.

Who do consumer insights benefit?
Consumer insights are invaluable for a range of direct beneficiaries, including marketing teams, product developers, and strategic planners. These insights serve as a compass, guiding businesses in tailoring their offerings and messages to resonate with their target audience.
More importantly, these insights gleaned pass value downstream to their consumers, inspiring a lift in KPIs such as product engagement, user retention, monetization, conversions, and reduced customer acquisition costs (CAC).
The business rationale for collecting and analyzing consumer insights lies in the commitment to make data-driven decisions. By understanding the underlying reasons behind consumer behaviors and preferences, companies can develop strategies that are not only reactive to current trends, but also proactive in anticipating future changes in the market.
The tangible value of insights for stakeholders, and product owners can be summarized by the following benefits:
- Guided Strategy Development: It provides a structured approach (e.g. segmentation analysis of the demographic, trend analysis etc.) which is crucial for developing effective business and marketing strategies.
- Informed Decision-Making: These insights enable decisions that align with consumer preferences, leading to more effective strategies.
- Efficient Resource Allocation: It guides where and how to best allocate resources (like budget and manpower) for maximum impact based on consumer insights.
- Risk Mitigation: By understanding consumer sentiments and reactions, potential risks and negative responses can be anticipated and managed more effectively.
- Improved Product Development: Insights from consumers help in tailoring products and services to meet the actual needs and desires of the target audience, enhancing user satisfaction.
- Competitive Advantage: Understanding consumer behavior provides a competitive edge, allowing businesses to anticipate market trends.
- Improved Marketing: Consumer insights aid in crafting resonant marketing messages, improving engagement and conversions.
- Enhanced Customer Experience: Insights help tailor user experiences to increase customer satisfaction and loyalty.

Methods for Collecting Consumer Insights
Various methods are used to collect consumer insights, each tailored to different aspects of consumer behavior. The choice of method depends on the insights sought and the research goals. Employing these techniques helps businesses develop a comprehensive understanding of their consumers, which is crucial for informed decision-making.
- Surveys and Questionnaires: These tools are widely used to gather direct feedback from consumers about their preferences, habits, and attitudes. They can be distributed online, in person, or through other channels.
- Interviews: Conducting one-on-one interviews offers in-depth insights into consumer perceptions and experiences. They can be structured or unstructured and provide a deep understanding of individual opinions and motivations.
- Focus Groups: Focus groups involve moderated discussions with a small group of consumers. They are useful for exploring reactions to a product or service and understanding the reasons behind consumer preferences.
- Online Analytics and Behavioral Data: Analyzing data from website analytics, app usage, and other digital platforms to understand how consumers interact with online content and services.
- Customer Feedback Channels: Utilizing customer service channels, like support tickets, emails, and call centers, to gather feedback. These channels often provide unprompted, genuine consumer insights.
Benefits of selecting ‘Surveys’ as a data collection method
While various methods for gathering consumer insights are valid and effective, we chose surveys as our primary tool in conjunction with behavioral analysis and user interviews. For the purpose of this playbook, we will expound on using surveys to gather consumer insights.
Selecting surveys as a data collection method offers key benefits, such as reaching a wide audience efficiently and gaining quantifiable insights. This approach is versatile and cost-effective, making it ideal for understanding consumer preferences and guiding business strategies.
Surveys offer several benefits over other data collection methods, making them a popular choice for gathering consumer insights:
- Broad Reach and Scalability: Surveys can be distributed to a large number of people across diverse demographics and locations, allowing for extensive data collection.
- Cost-Effective: Conducting surveys, especially online, can be more cost-effective compared to methods like focus groups or in-depth interviews which require more resources.
- Quantifiable Data: Surveys provide quantitative data that can be easily analyzed for trends and patterns, making them suitable for statistical analysis.
- Standardization and Consistency: The structured format of surveys ensures that each respondent receives the same questions, promoting consistency in the data collected.
- Versatility in Question Types: They allow for a mix of question types, including open-ended and closed-ended, catering to both qualitative and quantitative research needs.
- Rapid Turnaround: Digital surveys can offer quick turnaround times in data collection and analysis, which is beneficial for time-sensitive decisions.
- Ease of Administration: Surveys can be administered easily through various mediums like email, online platforms, or mobile apps, reaching respondents where they are most comfortable.
Different Types of Surveys
In the study of market research, surveys are broadly categorized into two types: qualitative and quantitative.
Each type serves a distinct purpose, and is designed to capture different kinds of consumer data and information.
Understanding the nuances of these two types of surveys is crucial for researchers to select the most appropriate type of questions based on their specific research goals and analysis.
A. Qualitative Surveys
Qualitative surveys utilize open-ended questions, ideal for situations where a conversational approach is more informative than a simple vote, especially when the range of possible answers isn't predetermined. These surveys seek responses such as comments, feedback, suggestions, and other non-numeric input that are not readily quantifiable. With qualitative surveys, you can gather detailed data from a smaller group of respondents, providing depth and richness to the insights.
B. Quantitative Surveys
Quantitative surveys are designed to gauge how many people engage in specific behaviors or hold certain opinions, primarily based on their self-reported responses. They are best suited for questions answerable via checkboxes or radio buttons and are useful when you need data that applies to a broad audience. These surveys typically involve randomly selecting a substantial number of participants from a target group and employ statistical analysis to ensure the results are statistically significant and representative of the entire population.
Drilling down: Survey Setup, Analyzing The Data, and Presenting Actionable Insights
We have established and highlighted the significance of consumer insights, how they add value and growth to a business, and the advantages of surveying as an effective collection method. Next, we outline a step-by-step guide for the optimal pathway to accomplish gathering, analyzing and presenting consumer insights as well as list down some of the best practices you can employ at each step to ensure success.

Step 1. Defining the Objectives of The Survey
Setting clear objectives is crucial when creating a survey for consumer insights. It determines what you aim to learn and guides the survey design, ensuring relevance to your business goals.
Key Elements of Defining Objectives
- Identifying Research Questions: Focus on specific questions you want to answer, like understanding user satisfaction or feature preferences.
- Alignment with Business Goals: Ensure the survey aligns with broader business objectives, such as improving a product or increasing market share.
- Determining Survey Scope: Decide whether to cover broad topics or specific aspects of consumer behavior or product interaction.
- Specifying Desired Outcomes: Clearly state what you plan to achieve with the survey data, like identifying improvement areas or measuring customer satisfaction.
Step 2. Identifying the Target Audience
Pinpointing the target audience is vital. This step entails selecting consumers whose insights align with the survey's goals, based on their demographics and behaviors. Accurate audience identification ensures relevant, actionable insights for strategic business decisions.
- Segmentation of Current Users: Analyze your existing user base to segment it into meaningful groups. This could be based on usage patterns, demographics, purchasing behavior, or other relevant criteria. Example: Segmenting users into heavy, moderate, and light users can provide tailored insights into each group's unique needs and preferences.
- Defining Hypothetical User Personas: Create detailed user personas based on market research, outlining potential users' characteristics, needs, and behavior. Example: For a new fitness app, personas might include fitness enthusiasts, casual gym-goers, or individuals seeking health improvement.
- Leveraging User Data: Utilize available data from your platform to identify which segments are most relevant to your survey objectives. Example: If the survey aims to understand feature usage, focus on users who frequently engage with different features of your platform.
- Utilizing Market Research: Conduct market research to identify potential user segments that align with the platform’s intended audience. Example: Analyzing market trends and demographic data to understand who might be interested in a new technology product.
Step 3. Calibrating for The Optimal Mix of Participants
Calibrating the participant mix in a consumer insights survey involves striking a balance between diversity and relevance to ensure a representative sample. This is crucial for obtaining comprehensive and actionable insights.
- Diversity: Ensure a diverse participant pool to encompass a breadth of perspectives, including age, gender, location, socio-economic status, and usage behavior.
- Relevance: Focus on participants who align with your survey goals, such as users familiar with specific product features under investigation.
- Segment Representation: Include representative samples from each identified target audience segment to avoid skewed insights.
- Sample Size and Composition: Choose a sample size that is statistically significant yet manageable and ensure it reflects your audience’s diversity.
- Pre-Survey Analysis: Perform an analysis beforehand to understand your audience's makeup and address any participant mix imbalances.
Step 4. Designing the Survey
When designing a survey, the crafting of questions is pivotal. It is the cornerstone of how effectively the survey will capture the necessary consumer insights. Thoughtful design involves not just the content of the questions but also their form and flow.
- Question Development Aligned with Objectives: Tailor questions to the survey's specific goals to ensure they gather data that's relevant to your research interests. The questions should aim to elucidate consumer behaviors or opinions pertinent to your objectives.
- Selection of Question Types: Choose from a range of question types based on what you need to know. Multiple-choice questions can be used for gathering specific data, open-ended questions for narrative insights, Likert scales for gauging attitudes, and ranking questions to understand consumer preferences.
- Clarity and Unbiased Wording: Questions must be articulated clearly to prevent misunderstandings and crafted neutrally to avoid swaying respondents' answers, ensuring the collection of unbiased data.
- Logical Sequencing: Organize questions in a coherent sequence, beginning with broader topics before delving into more detailed inquiries. A well-structured survey facilitates respondent engagement and minimizes the risk of survey fatigue.
- Balanced Mix of Question Types: Incorporate a healthy mix of different question types to engage respondents and gather varied insights. Combining multiple-choice with open-ended questions, along with Likert scales and ranking questions, ensures a comprehensive understanding of consumer attitudes and behaviors.
- Randomizing Multiple-Choice Options: To avoid response bias, randomize the order of options in multiple-choice questions. This ensures that respondents' choices are not influenced by the positioning of the options, leading to more accurate data collection.
- Suggested Tools: There are several excellent tools available for setting up and distributing surveys, some best in class examples of the tools are below:
- SurveyMonkey (User-Friendly Interface)
- Google Forms (Free and Simple)
- Qualtrics (Advanced Research)
- Zoho Survey (Seamless Integration) etc.
ProTip: Conduct a Pilot Survey
Before launching the main survey, conducting a pilot test with a limited audience is crucial for identifying and resolving potential issues. This preliminary step involves sending out the survey to a small, representative sample of the target audience. The goal is to uncover any unforeseen problems in question clarity, survey length, technical glitches, or respondent understanding that might affect the quality of the data collected.
- Identify Question Clarity Issues: Determine if the questions are easily understood and if they elicit the intended responses.
- Assess Survey Length and Flow: Check if the survey length is appropriate and if it flows logically without overwhelming respondents.
- Spot Technical Glitches: Identify any technical problems within the survey platform that could hinder the completion or submission of responses.
- Gauge Respondent Understanding: Ensure that respondents interpret questions as intended, providing valuable feedback for adjustments.
- Refine Based on Feedback: Use feedback from pilot participants to refine the survey, enhancing its effectiveness for the broader audience.
Step 5. Analyzing the Data
During data analysis, survey responses are scrutinized to identify key trends and patterns. This step combines statistical and qualitative methods to reveal consumer sentiments and preferences, essential for shaping strategic business decisions.
- Data Cleaning: Initiate the analysis by rigorously cleaning the data to rectify any inaccuracies or discrepancies, which is crucial for maintaining the integrity of the subsequent analysis. This step often includes removing duplicate entries, correcting misclassifications, and addressing missing values.
- Data Coding (if necessary): For qualitative or open-ended survey responses, systematically categorize the information into coherent groups or themes, which facilitates easier identification of patterns and focal points in the narrative data.
- Statistical Analysis: Utilize statistical methods suited to the data type and research questions at hand, such as regression analysis, t-tests, or chi-square tests, to uncover underlying structures or relationships within the quantitative data.
- Qualitative Analysis: Dive deeper into qualitative data by employing techniques such as content analysis or thematic analysis, which can highlight prevailing sentiments or viewpoints, and provide context to the numerical data.
- Integrate Findings: Synthesize the insights gained from both the quantitative and qualitative analyses, cross-referencing them to build a nuanced and multi-dimensional portrait of the collected data, thereby enhancing the robustness of your conclusions.
Step 6. Synthesizing and Presenting The Outcomes
In presenting the survey outcomes, key findings are summarized using visuals like graphs and charts to clearly convey insights. This stage focuses on effectively communicating the data story, ensuring stakeholders understand and can act on the insights for strategic business decisions.
- Presenting the Business Rationale and Purpose of the Survey: Clarify the survey's strategic intent, framing the data presentation and connecting the audience with its objectives.
- Presenting the Demographic Data of the Survey Population: Provide a snapshot of respondent demographics to inform the interpretation of survey results.
- Displaying Raw, Objective Question Data: Show unedited data using visuals to establish a baseline for analysis.
- Synthesizing Objective Question Data into Survey Insights: Distill data into key insights, highlighting relevant trends and patterns.
- Offering Well-Informed Recommendations: Deliver concise, data-driven recommendations guiding future business decisions.
Suggested Tools:
- Microsoft PowerPoint (Professional Presentations)
- Google Slides (Collaboration-Friendly)
- Miro (Interactive Whiteboards)
- Prezi (Dynamic Layouts) etc.
Best Practices for Data Presentation
When presenting data, adhering to the best practices below will elevate the data story and produce a better more helpful narrative. This involves ensuring that all data is contextualized to align with the business's strategic objectives, selecting the right visual tools to simplify complex information and crafting concise summaries.
Effective data presentation not only conveys the findings but also engages the audience, facilitating informed decision-making based on the visualized insights.
- Consider Graphs Early: Plan your spreadsheet layout with the end in mind, knowing that some data may need to be reorganized for effective graph creation. This foresight can prevent the need for complex data manipulations later on.
- Summarize Key Findings: Highlight the most significant and relevant findings from the survey, aligning with the initial objectives.
- Prevent Data Loss in Charts: Stay vigilant about spreadsheet behaviors that can obscure data, such as font-size adjustments or chart resizing, which can inadvertently hide important information.
- Make Sure the Report is Accessible: Use formats or platforms that make it easy to navigate through the report.
- Opt for Screenshots Over Embedding: When incorporating data visuals into reports, use screenshots (PNG format preferred) instead of embedding, to avoid issues like document corruption or accidental data unblinking.
The final resources shared can vary in their format as well as their delivery. Some viable options could be:
- Presenting the final report in the form of a document
- A comprehensive presentation comprising an introduction to a conclusion, which could be shared or presented
- Presenting the final outcomes in the form of an interactive session while presenting the results using some visual aides (slides, etc.)
Contextual Reference: Sample Survey Setup
To provide a practical example, we have included a section walking through a sample consumer insights survey.
Context on our Client
For this sample, we are using the product persona of an alternative investing platform that allows investors of all backgrounds (retail and accredited investors) to make fractional investments into a U.S.-based energy firm that offers IRA-eligible returns of 10% annual yield.
The consumer insights research conducted was to gain valuable insights and de-risk product roadmap decisions as they considered designing, building and launching a robust investment platform to new and existing investors.
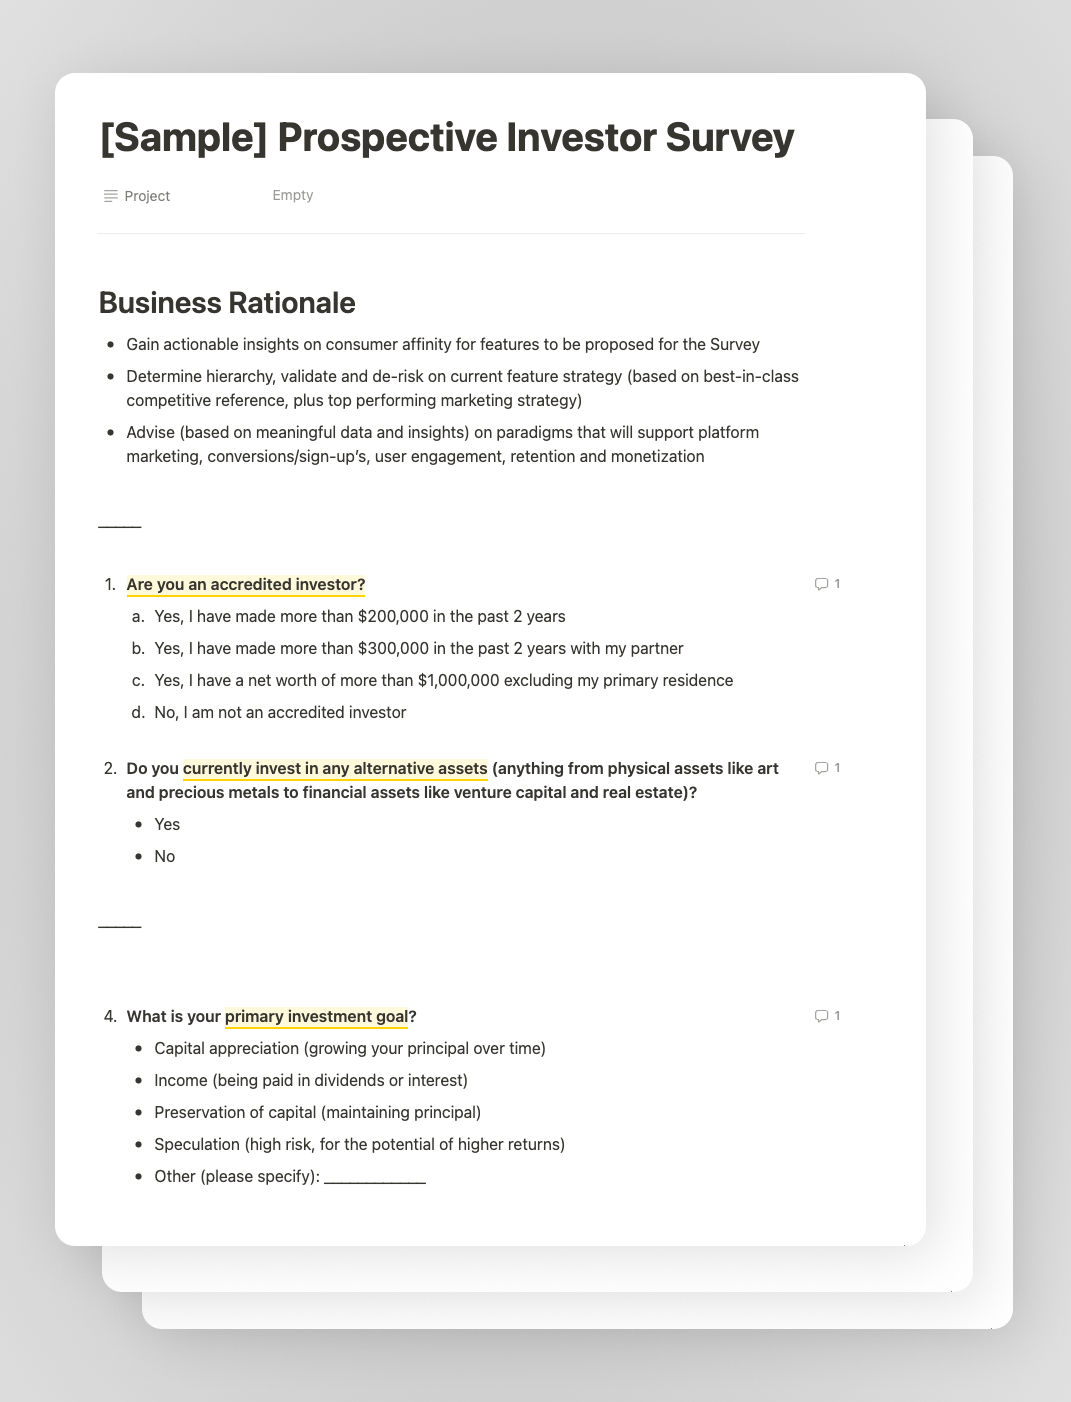
Business rationale & objectives of the survey
The survey's objectives were to understand the investor experience (pain points, affinities, etc.), identify engagement-driving features, and assess interest in oil and gas investment alternatives. Some of the key objectives were:
- Investor Experience/CX Affinities: Understand the preferred tools, customer experiences, and features that positively influenced investor engagement with the platform.
- Platform Switching Incentives: Identify the key platform features that would motivate investors to switch from their current investment platform to this new one.
Critical data we sought from the survey
Based on the objectives, there were a few particular topics of interest that we wanted to dive into. These data points provide insights that would allow us to calibrate our recommendations and findings.
Some critical information we sought included:
- Do participants currently invest in any alternative assets?
- Content and features most valued in an investment platform, and the primary variables considered when investors choose a platform
- Types of content that resonate most from an investor's point of view
Step 1: Consider the demographics of product audience
To understand a product/platform's full potential, analysts and researchers must consider both sides of the user spectrum: current users - those currently engaged with the platform, and prospective users - those exploring our niche or seeking investment opportunities.
By examining data from any current users, including their actual affinities, factors contributing to user retention, and elements driving loyalty, we obtained valuable insights that may identify the most suitable persona for our potential users. This persona should illustrate and outline the needs, affinities and motivators of our platform's “high lifetime value (LTV) user.”
A sample survey results' from Current Users on the platform
Some things to consider when having “Current Users”:
- Their positive bias stems from an established relationship with the product, reflecting a level of commitment and expectation.
- In-depth feedback is informed by their historical usage, as well as their close relationships with the product team fostered over time.
- Economic ties to the product's performance influence their expectations for the company's future. e.g., “I want this product to do well and grow my investment in value, so I will not sayin anything negative/critical about it.”
- Affinities include desires for continuous improvements and enhancements while maintaining the core value they initially invested in. e.g., “I want more, better, etc., while fulfilling the original job.”
Some affinities to consider that “Prospective Users” have for FinTech products:
- Prospective FinTech Users seek a tangible, reliable, and easy-to-understand business model that they can invest in.
- They seek a well-defined, well-presented investment offerings to which they feel comfortable and confident committing their money.
- They seek compelling reasons to switch from their current providers, requiring clear value propositions.
- Their affinities are geared towards seeking superior features, efficiency, or benefits compared to their current tools. e.g., “I want more features, higher ROI, and a better experience than my current tool.”
ProTip: Consider which demographics are most critical to you product solution, as not all “Prospective Users” are going to engage and/or invest equally
In order to focus on highest-value users, we prioritized the demographics whose investment behaviors align closest with the assets of this platform, while considering factors such as financial capacity (such as household income), life stages for their investing preferences.
Based on these considerations, the target demographic was selected as the following:
- Geographic Location: USA
- Age: 45-60 years old
- Gender: Male & Female
- Income Group: $125 - 200k$ (and above)
- Accreditation Status: Accredited & Unaccredited
Step 2: Designing the Survey
The next step is to compile questions for the survey script. Consider the following:
- Analyze current consumer demographics and affinities
- Compile competitive references from the best-in-class platforms that are current market leaders for those demographics.
Samples of feature reference from other alternative investing competitors
- Utilize existing market analyses and past consumer insights surveys to gain a deeper understanding of current market trends and consumer behaviors. Some examples of this are given below:
- McKinsey's Consumer Pulse Surveys: McKinsey's surveys, such as the one conducted in early 2022 and another in early 2023, collected responses from thousands of US adults to assess consumer spending patterns and attitudes.
- PwC’s Global Consumer Insights Survey: In June 2023, PwC conducted a survey involving nearly 9,000 consumers from 25 countries, highlighting the importance for companies to empower consumers with tools, information, and support for decision-making.
- Form a question bank that includes different buckets of consumer themes. In the case of our Prospective Users, we placed questions into the following categories:
- Demographic information
- Investment preferences
- Platform preferences
- Switching to our platform (from their existing investment platforms)
- Communication and engagement
- General feedback
Screenshot of a question bank
- Compile a survey script and narrow down the set of questions from you question bank, adhering to these key guidelines:
- Objective Alignment: Ensure questions directly serve the survey's goals.
- Clarity: Opt for straightforward, easily understandable questions.
- Audience Relevance: Choose questions relevant to your target demographic.
- Bias Avoidance: Maintain neutrality to ensure unbiased responses.
- Conciseness: Keep the survey brief to enhance response quality.
A sample image from a first draft from the survey script
Step 3: Launching a Survey
When launching a survey, a strong recommendation is to first conduct a pilot survey test before the official survey launch to identify potential issues, and mitigate risks to the full survey campaign. The pilot survey can be sent to a smaller cohort of participants (representative of our target audience), with a focus on question clarity and unbiased responses, respondent comfort with the survey length, and identifying any technical glitches. Once you receive feedback on this pilot survey, make refinements to optimize the survey before spending your full budget on the larger, full survey.
Once you have polished your survey, it's time to deploy the full survey campaign to consumers to start collecting data! In order to achieve some level of statistical significance, there needs to be enough participation and survey responses collected to have confidence in the insights. We recommend running a survey to no less than 100 participants, while having at least 500+ participants ensures clear confidence in the results.
Step 4: Analyzing the Data
Analyzing data starts with aggregating the data (form all of the many responses), data cleaning (to remove any incorrect data), and visualizing the qualitative and quantitative data collected from the survey.
Raw data analysis and visualization
In the first stage, we documented our initial observations and insights alongside the data, creating a detailed “data narrative” that allowed us to tell the true story for the responses to each question in the survey.

Here is a sample analysis of survey data. This screenshot shows the detaile breakdown for two questions.
Generating actionable insights and recommendations
As you analyze and unpack the findings from each question, the next step is to begin drafting actionable insights and recommendations
ProTip: Breaking down the survey data for each question by various demographic categories such as gender, age, financial status/accreditation, and income may help discern patterns in investment behaviors.
ProTip: Have an exercise where you attempt to “tell one insightful story” from the objective data from each question. Do the responses objectively state that [x] users are likely to prefer [y] traits?

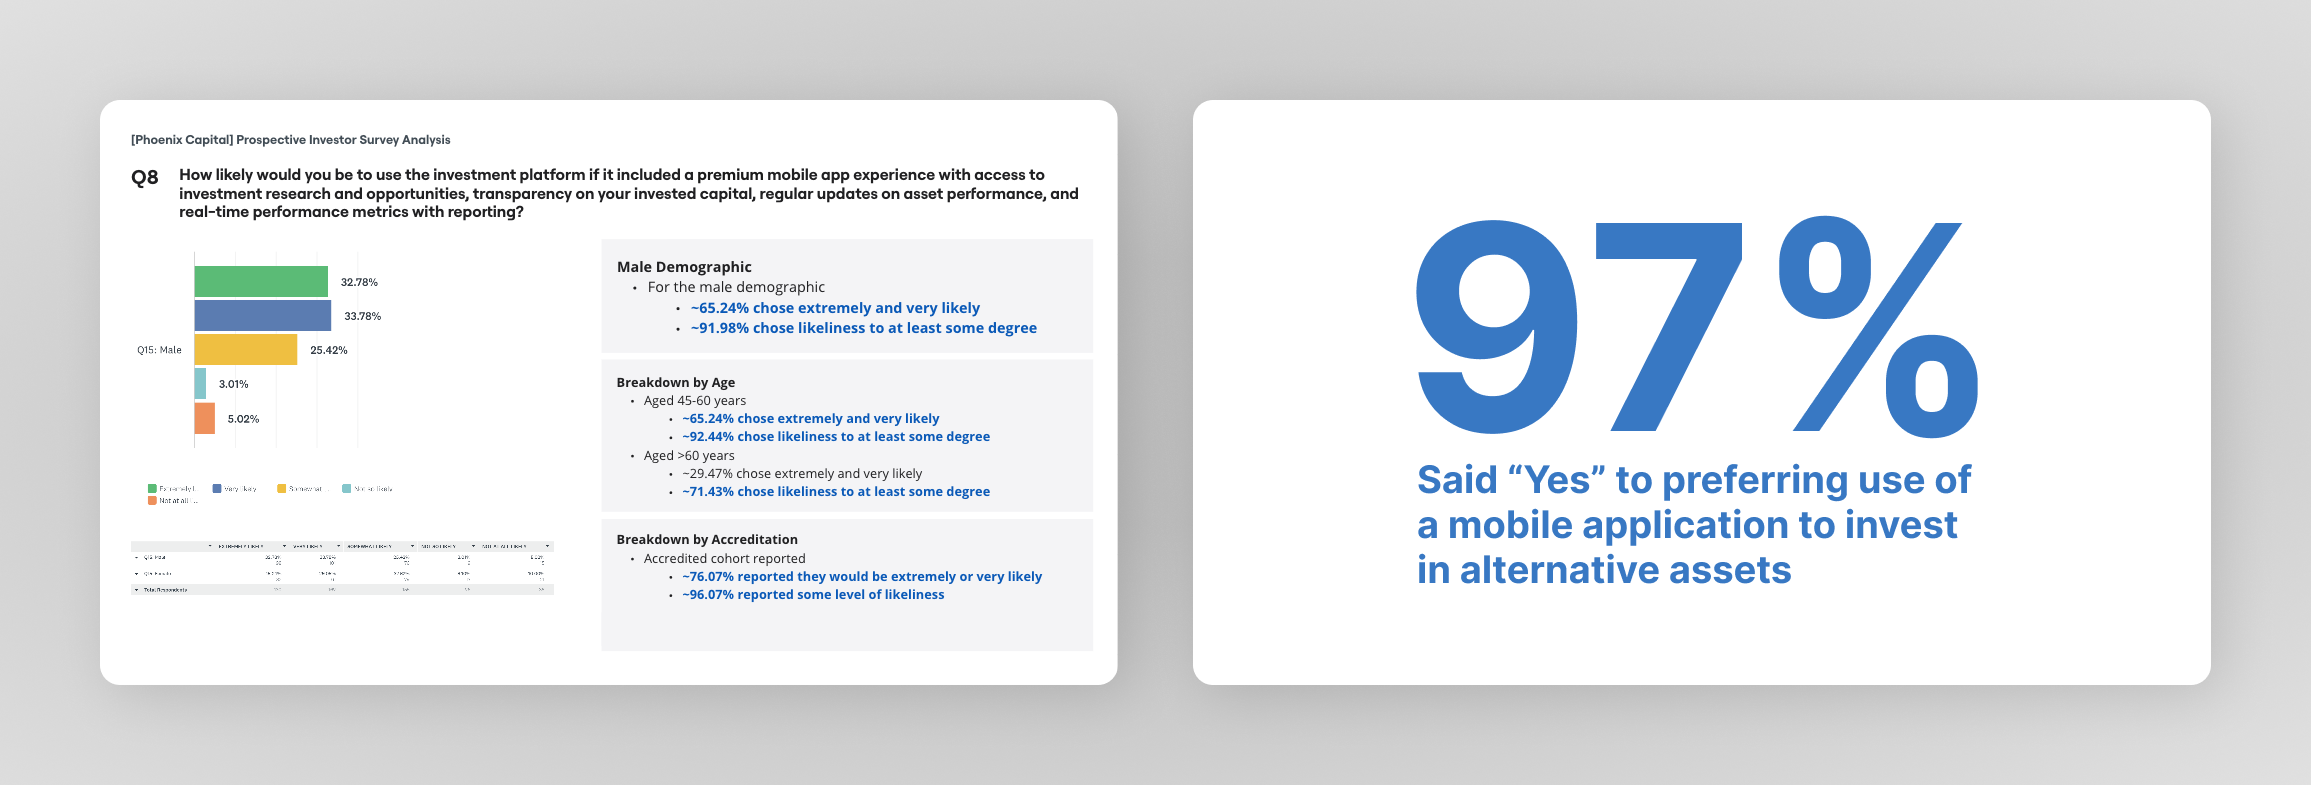
Here is a sample analysis of 4 survey questions, with bullet points of the actionable insights and recommendations.
Step 5: Presenting the Outcomes
The final step is to construct a visual narrative that guides the audience, client or stakeholders through the data's story, emphasizing key insights and supporting strategic recommendations. This visual journey is designed to engage stakeholders, and clearly showcase the data's implications for informed decision-making.
ProTip: Offer a clear business rationale and objective of the survey
Before diving into our findings, providing a clear introduction is essential. To set the stage for your recommendations, ensuring that they are well-aligned to the goals of the audience, client or stakeholder.
A best practice for this is to begin the survey report with the business rationale to the survey - recite “why” this consumer research was facilitate in the first place, along of the goals of the analysis.

Sample slides showing the purpose, business rationale and survey objectives
ProTip: Understand the demographic data of the survey population
This In order for the audience to understand what the survey participants had to say, it is important to explain who the survey participants (population) were. Provide an executive summary of their location, age, gender, income, and accreditation, which will help your audience grasp how these characteristics influence the research takeaways.
This can also be achieved through visualizing a summary of survey participants.

A sample demographic breakdown of a consumer insights survey
ProTip: Display your data and insights in an intuitive way
Keep the reporting simple, rather than complex - concise headlines often carry more impact than a slide with dense data throughout.
 A sample of a reporting slide with a key takeaway from one survey question
ProTip: Offer Well-Informed Recommendations
Finally, offer your stakeholders, clients or audience a series firm and actionable recommendations, based on the data captured in the survey. These recommendations might be simple, such as follow-up's to this analysis that are inspired by new data revelations. Alternatively, the recommendations may include more robust feedback, such as adjustments to the current user experience, or even entirely new features that the survey participants have affinities for.
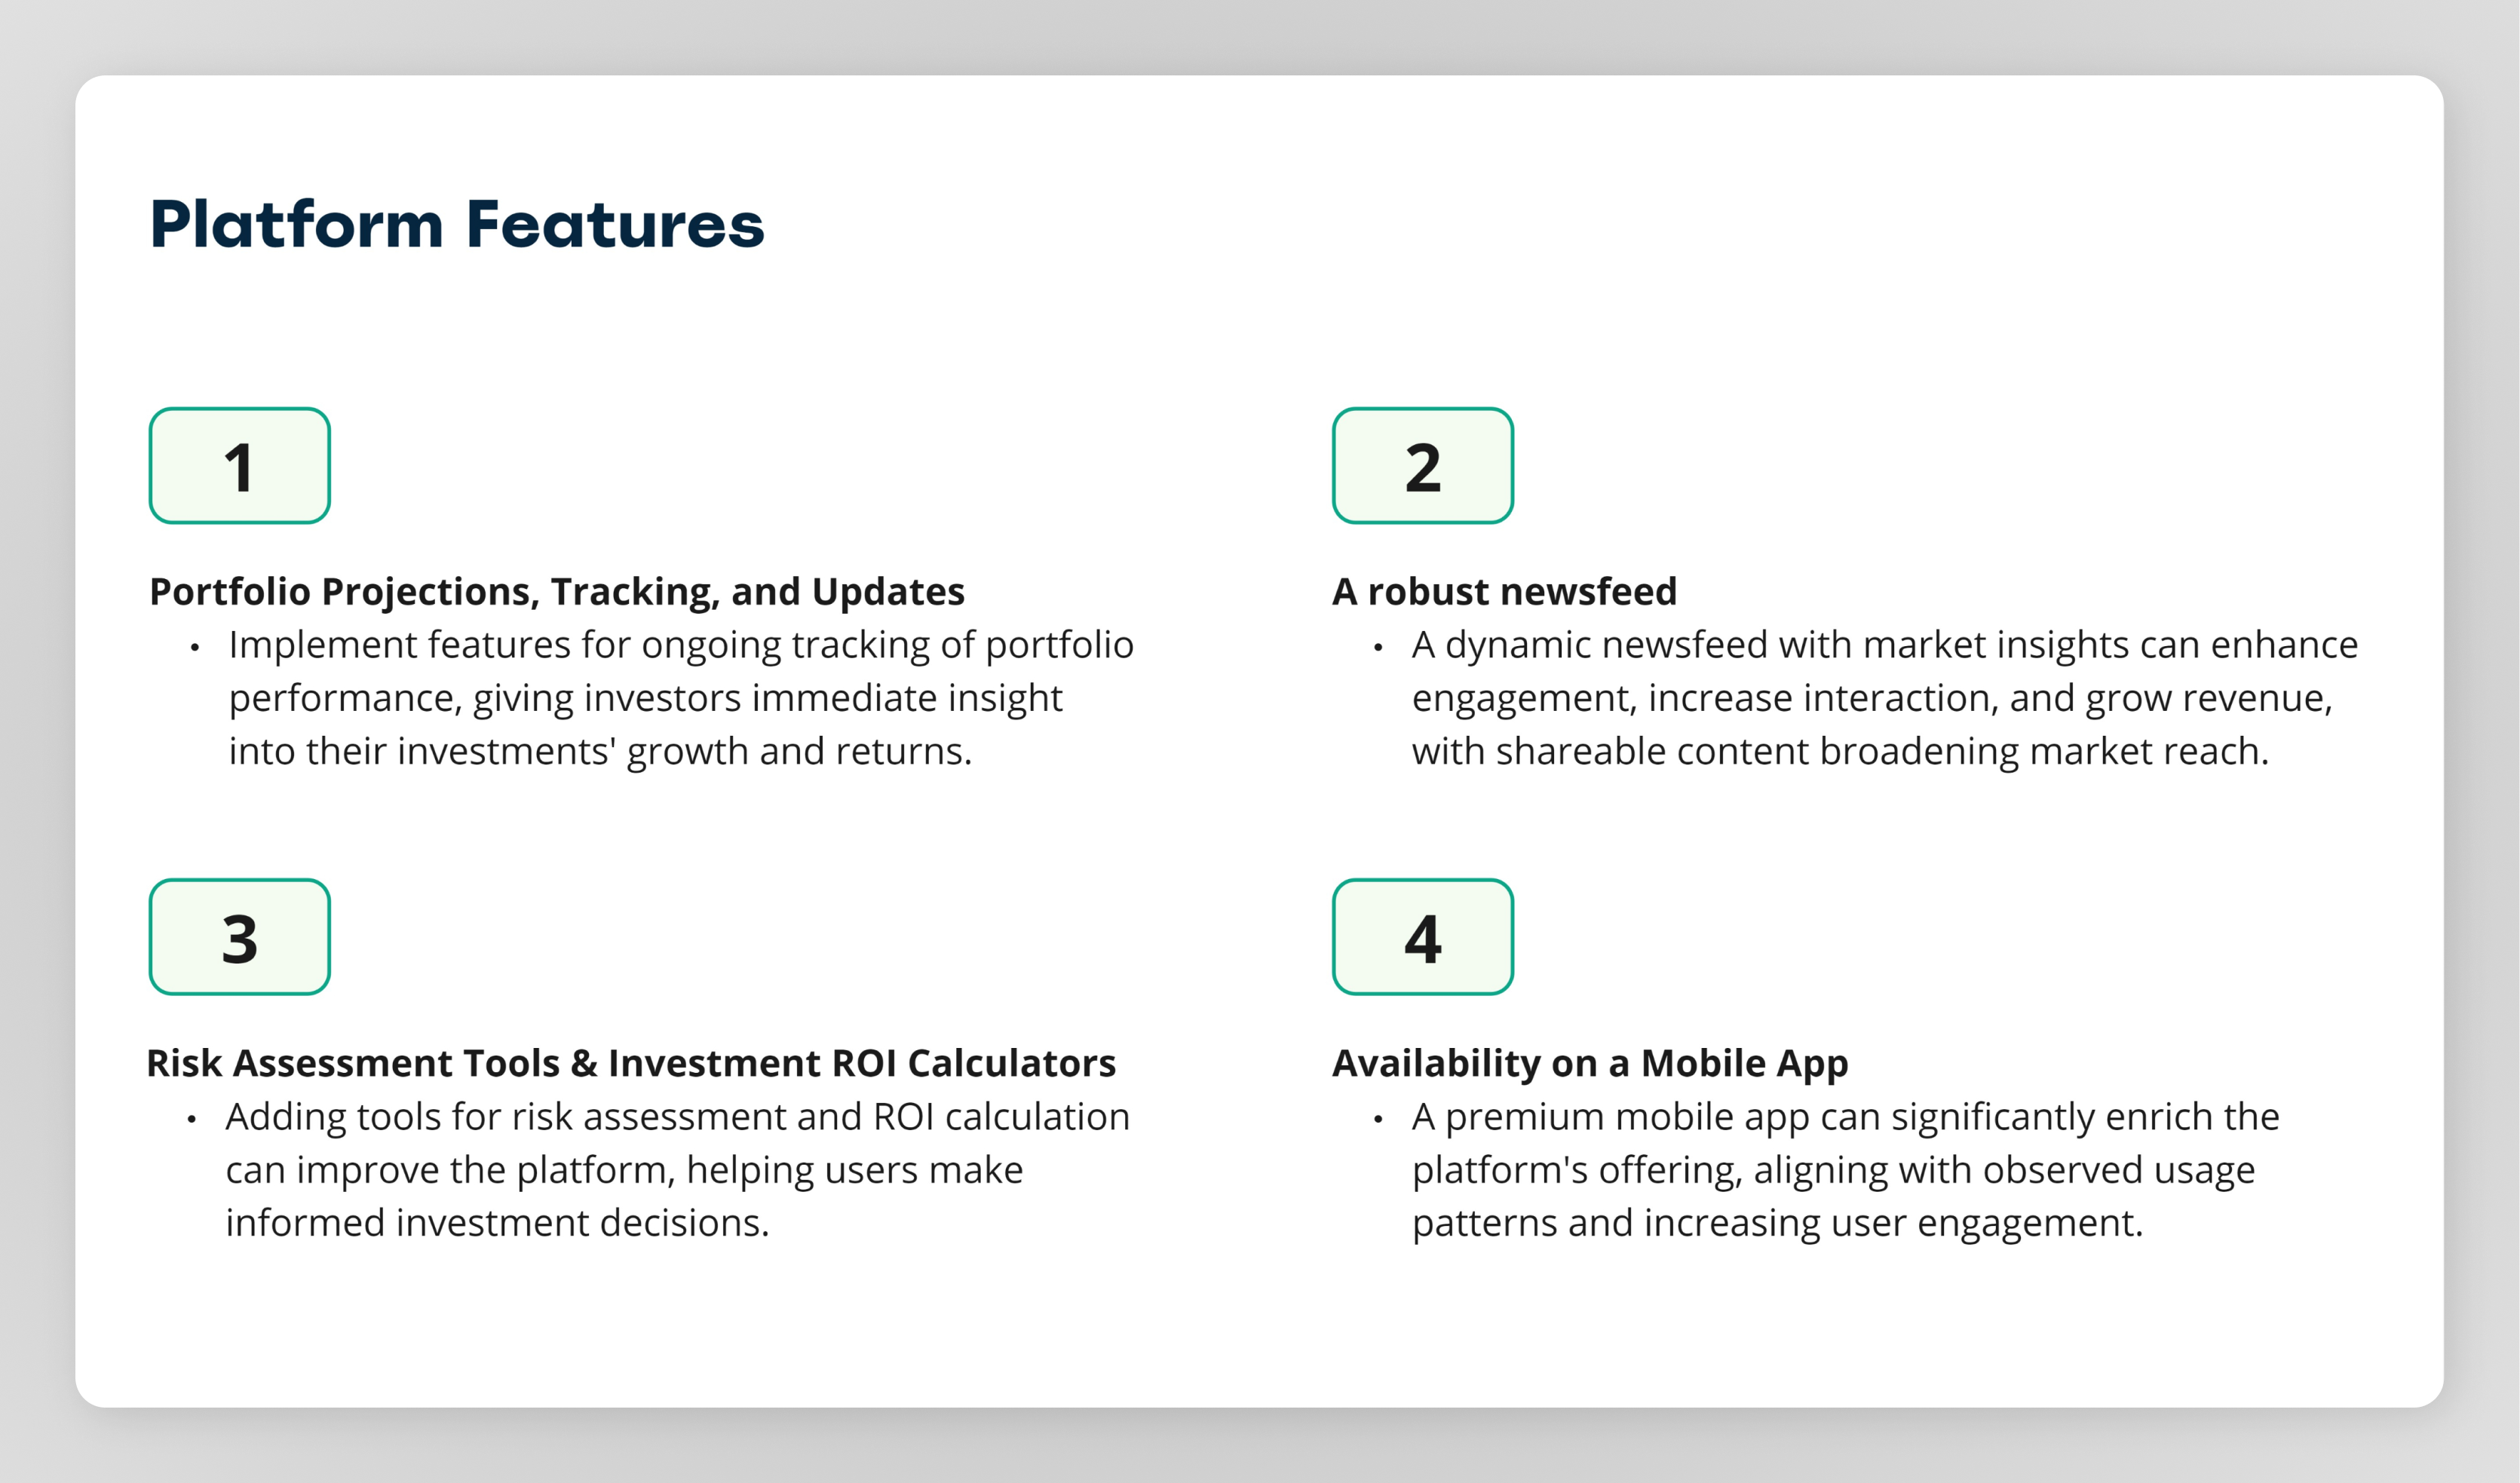
A sample of a platform recommendations slide
ProTips: Tools Used
Here are the tools that were used to design, distribute, analyze and present the data:
- Notion: Designing the survey and the final script
- SurveyMonkey: Selecting the audience, distributing the data, collecting responses
- Miro: Collecting references, forming a question bank, presenting the survey report
In Conclusion
By methodically setting up a survey to the proper audience, aggregating data, conducting a robust analysis, and synthesizing data into a report of actionable insights, you now have a robust foundation for informed product decision-making.
The value created for businesses that invest in market research and consumer insights is substantial, providing them with a deep, data-driven understanding of their consumers, which is crucial for tailoring products, services, and strategies that genuinely meet market demands and drive sustainable growth.
The entire process demonstrates how a structured and intentional approach to consumer insights can mitigate product risk, optimize successful outcomes, and ensure that our product decisions are aligned to the needs of the consumers.
Learn More
If you are interested in learning more about user research best practices, and how these methodologies can create value for your firm and its unique ecosystem of products, services or features, send a friendly hello to us.
 Hamayun Zafar - Senior Product Designer
 Marina Revutska - Head of Design
 Lawrence Valenti - CCO & Managing Partner
Learn more about how we use data-driven design solutions to engage, retain and monetize users to drive growth

About Scalio
Scalio is a global digital product agency driving digital success in over 30 industries. Through expert engineering, strategy, and design, we build and scale platforms and digital experiences for global brands.
Learn more about our expertise in your industry.
_
If you have more questions or interest in meeting Scalio Leadership Team, feel free to reach out for a friendly follow-up!

Lawrence Valenti
CCO | Managing Partner
Email: [email protected]
LinkedIn

Joshua Lucas
COO | Managing Partner
Email: [email protected]
LinkedIn

Micah Lucas
CTO | Managing Partner
Email: [email protected]
LinkedIn

Bradley Greenwood
CEO | Managing Partner
Email: [email protected]
LinkedIn